![]()
D-Lib Magazine
July/August 2000
Volume 6 Number 7/8
ISSN 1082-9873
Designing Documents to Enhance the Performance of Digital Libraries
Time, Space, People and a Digital Library on London
Gregory Crane
Tufts University
gcrane@perseus.tufts.edu
Introduction
In a mature digital library (DL), documents should coexist with a Geographic Information System (GIS). The GIS component of the DL should be able to scan documents for toponyms and then generate a map illustrating the places cited in a document. This visualization should be available in both static and dynamic form. The system should be able to generate an animation showing the place names in the text in the order in which they appear, allowing the reader to see the shifting geographic focus of the document. It should be possible as well to indicate the frequency with which places are mentioned, and readers should, of course, be able to go from locations on a map to places in the DL which mention them.
One of our current research projects is to explore the extent to which geographic visualization tools can help readers grasp the complex temporal-spatial interactions that shape many (especially historical) documents. For cultural digital libraries, time and space are crucial categories of information. Our goal is to develop a temporal-spatial front end for digital libraries, including the Perseus project [1]. To accomplish this goal, we have developed a testbed on the history and topography of London. The testbed includes dense and precise quantities of temporal and geospatial information embedded in texts, maps and images. We have been seeking ways to disambiguate and link automatically the information found in the collection.
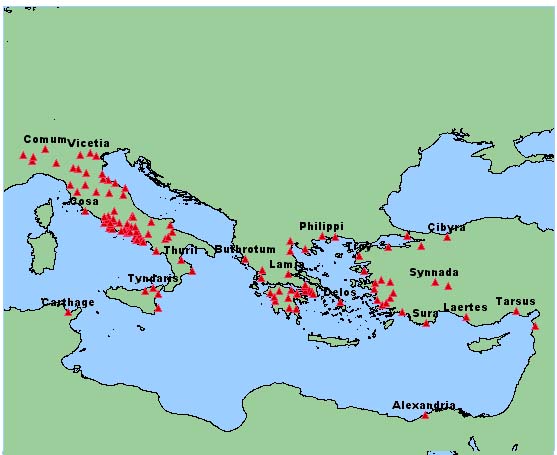
Figure 1: The above map plots the possible locations mentioned in Cicero's Letters, using a restricted set of toponyms developed for Greco-Roman Perseus.
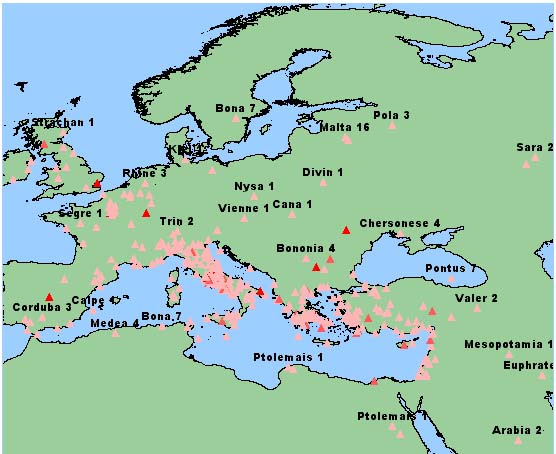
Figure 2: The above map plots the possible locations mentioned in Cicero's Letters but using the Getty Thesaurus for Geographic Names without any disambiguation strategy. Note such unexpected phenomena as Malta in northern Europe.
The Electronic Bolles Archive of the History and Topography of London
Edwin C. Bolles (1836-1921), for many years chaplain at Tufts University, collected 35 "full-size" and 320 more specialized maps, 400 books (284 linear feet of shelf space) and 1,000 pamphlets documenting the history and topography of London and its environs. The collection includes a number of "extra-illustrated" editions - books to which Bolles painstakingly added supplementary illustrations. At the center of the collection stands an extra-illustrated version of a six volume series entitled Old and New London, a six volume series from the 1870s by Walter Thornbury and Edward Walford. In the final years of his life, when he himself was almost blind, Bolles supervised the addition of 7,500 images, many from old and historically important prints and each linked to a specific section of the text. The pictures were so numerous that they could not be rebound into the original books. The result was a paper hypertext: underscores in colored pencil (often blue) mark segments of the text for which extra-illustrations exist. To those familiar with the World Wide Web, the blue "links" are uncannily familiar. A man who was twenty-five when the American Civil War broke out anticipated the basic look and design of a revolutionary, late twentieth century information system.
After Bolles' death, these materials became part of the university's special collections, where they have remained a relatively unknown and definitely underutilized resource for nearly eighty years. The Perseus Digital Library Project collaborated with the Tufts University Archives to begin digitizing this collection. An initial grant from the Berger Family Fund for Technology Transfer got us started. The Perseus Digital Library Project and the University archives, directed by Gregory Colati, have collaborated on this work from the start. Subsequent support from Tufts University and from DLI2 provided us with the infrastructure for development, and support from various sources at Tufts has allowed us to expand our holdings. The Bolles Archive is evolving into a crucial testbed within our overall digital library research1.
Construction of the Testbed
At present, the testbed includes TEI encoded texts (c. 5,000,000 words), 10,000 scans of illustrations, 2,400 new pictures of London and its environs, and ten geo-referenced maps. We expect that the corpus will increase to more than ten million words before the end of this calendar year.
For budgetary reasons, we needed to rely upon OCR rather than professional data entry for our work so far. This affected our selection of texts (we focused on documents that would scan well) and greatly increased the amount of manual post-processing. Even with the most advanced OCR software available (http://www.primerecognition.com), the process was slow and results uneven. We may have saved on the explicit data entry bill, but we spent at least as much as we saved in labor. In the end, we assembled an initial corpus of almost five million words now in TEI conformant, richly tagged documents2.
We used a high-speed grayscale scanner to acquire most images. We digitized images at 400 dpi with 8-bit grayscale, although we consider this resolution marginal for many purposes. An archival scan should contain enough data so that students of engraving could, for example, study not just the content of the drawing but the quality of the lines. Given the limitations of time and resources, we felt that this was the best we could do, but feel that this work should be redone in the future. Nevertheless, we were able to acquire 10,000 images in less than a year with part time student labor, thus creating a core of sufficient size to be interesting and with images that surpass in resolution the reprints in most printed books. These images include portraits, views of buildings, images of original documents, and newspaper clippings. Likewise, Maria Daniels, then the photographer for the Perseus Project, captured 2,400 color images of contemporary London using a digital camera. For reasons of practicality (and security), we chose not to use our higher end camera (a Kodak DCS460 with 2000 x 3000 resolution) but a mid-range device (a Nikon E-3 with 1280 x 1000 resolution) to capture data in the field.
Images were scanned and cropped for presentation. Large images are broken up into tiles and users can drill down from lower resolution overviews to the full resolution of the original scanned image. We did not have the resources to provide cataloguing information for all 10,000 images entered in the first year of work. Each image digitized from a book is, however, linked to the point in the text from which it is drawn. The caption in the text provides the initial metadata for the image. Since the captions are embedded within hierarchically structured texts, we can extract information from the document structure: thus we may know not only that an image shows "Adam street" but that the image comes from a chapter that describes "Manchester square."
The 7,500 "extra illustrations" that Bolles linked to Old and New London are more challenging, since most of these are linked to spans of source text. The selected text usually proves to be reasonably descriptive (e.g. " Vicar General's Office" or "Richard III") but the scope of other text spans are more local in significance (e.g., " The bowl of the font"). The images thus work well in their immediate context, but the tags with which they are associated will often prove of little use if extracted and placed into a stand-alone database. We need to see how much information we can automatically extract from the immediate context to flesh out the information about all of the images derived from books.
We defined large scale maps as those which could not fit on any of the flatbed scanners to which we had access. We sent more than thirty large scale maps to an outside service to be digitized. For practical reasons, we chose to digitize these color images at 300 dpi. The resulting images were substantial by contemporary standards, ranging from c. 100 to 400 Mbytes, but higher resolution would improve the legibility of many small streets and individual details. The digitized maps range from 1790 through the end of the nineteenth century and include Charles Booth's maps illustrating London poverty.
When we geo-reference historical maps, we use a Geographic Information System (GIS) to align them onto a common, modern geospatial dataset. We use the Bartholomew Mapping Solutions' 1:5000 data to provide our reference map3 and ESRI's Image Analysis Extension4 to align the historical maps -- insofar as the surprisingly variable data permits. Geo-referencing historical maps currently takes roughly two hours of labor. The speed of the machine is, for the moment, a limiting factor (we spend a great deal of time waiting for things to happen). The nature of the data also slows down the process. The 18th and 19th century maps that we are aligning vary in many details from each other and from the modern GIS. Geo-referencing one section of the map often throws another section out of alignment so that a great deal of tweaking is necessary, and the results are always approximate. The deviations of historical maps from modern surveys means that it would be very difficult to use them as source materials from which to extract vector based information about vanished streets. But despite these deviations, we can effectively align arbitrary sections of historical maps. The modern Bartholomew data becomes the common interface between the various historical maps.
The Bartholomew data provides vectors for buildings, streets and other geographic features. We can thus generate views that highlight the street or building in question. (See below.) Where possible, we digitize print indices to the historical maps as well. These generally have the form:
|
D d |
Adam street |
Adelphi |
|
A c |
Adam street |
Edgeware road |
|
B c |
Adam street |
Manchester square |
|
G f |
Adam street |
New Kent road |
|
B d |
Adam's mews |
Grosvenor square |
The coordinates in the historical map are crude, but useful. All four instances of "Adam street" above fall in different boxes and thus have different simplified locations. These x-y coordinates describe squares that are one half mile in size. These coordinates are coarse but they can nevertheless be used to measure the probable difference between the four possible Adam streets and the general geographic context of a passage.
Automated Tagging of Text
In tagging texts, we begin with the basic document structure: chapters, sections, headers, notes, blockquotes, etc. We have only begun the process of identifying individual bibliographic citations and linking these to formal bibliographic records for author and work. We have tagged most foreign language quotations, letters, extracts of poetry, etc. by hand 5.
Two other levels of information are added to the documents. The boundary between these levels is flexible but the general distinction is clear. When we can identify particular semantic classes with reasonable reliability, we encode this information as tags within the SGML/XML files. Some of the trusted metadata that can be used to identify and map keywords onto discrete semantic classes includes gazetteers or biographical dictionaries. With "looser" metadata, such as the headings of reference works and captions of pictures, the presentation manager adds links at "run-time." In both cases, however, the operations are automatic (although human editors could -- and in some cases surely will -- subsequently refine the results of automatic text processing at any stage).
Automatic routines add tags for dates, money, and proper names. At present, we find that very simple routines provide good initial results 6. References to money are usually accompanied by designators such as "£", "l.", "s.", "marks", etc. After developing heuristics for isolating dates, we discovered that more than 90% of all numbers not otherwise tagged between 1000 and 1900 were dates in this corpus. We were able to identify most dates and references to money with a relatively simple algorithm. Proper names proved (as we expected) a good deal harder to isolate.
While a substantial amount of work has gone into feature extraction (e.g., in [2] and [3]) and various systems have been developed for this purpose, they work best in conjunction with various knowledge bases -- e.g., lists of known first and last names for a given culture, gazetteers that document known place names, etc. Most feature extraction focuses on modern sources (e.g., Wall Street Journal News Feeds"). Since we were working on an earlier historical period, we needed to collect earlier resources as well.
- The Getty Thesaurus of Geographic Names 7. The TGN is a global resource with roughly 1,000,000 entries and increasingly detailed coverage. Names are associated with longitude and latitude coordinates, as well as with hierarchical information, linking from, for example, city to region to nation to continent. This information facilitates subsequent automatic disambiguation. The magnitude of the list creates anomalies -- "Marble Arch" in our corpus almost always refers to a place in London but in the TGN, which has a much broader geographic focus, it only designates a site in Libya.
- The Bartholomew Mapping Solutions' 1:5000 data provides toponyms for London. There are, for example, 10,000 unique street names. Each of these streets is associated with a series of vectors, located within London. This vector data can be used to locate homonymous streets, buildings and other features in space and thus to determine which is most probable in a given context.
- Indices to historical maps from the nineteenth century refer to streets and other geographic features that have disappeared and are thus not in modern GIS data sets. We have at present added the 4,200 entry index to the 1828 Cruchley map of London. The Bolles collection contains several other indices to its maps and these will be added later.
The index and abstract to the Dictionary of National Biography ([4]) contains names, dates and brief descriptions for more than 33,000 individuals. We can use these names as wholes (e.g., "Oliver Cromwell") or as constituents: Cromwell appears 9 times as a last name and 5 times as part of a forename, and Oliver 23 and 20 times as a surname and forename, respectively.
Several features of the DNB entries offer promising heuristics for a DL system trying to disambiguate personal name references (e.g., which "Oliver Cromwell" is mentioned in a given passage).
First, DNB entries contain dates for individuals. Thus, there are two entries for "Oliver Cromwell": the "Protector," with dates of 1599-1658, and a biographer, who lived from 1742 to 1821. Since we track the dates in a document, the DNB dates provide us with a heuristic to distinguish between the two Cromwells in a given passage.
Second, carefully edited reference works generally devote more space to more widely discussed entities. We already exploit this phenomenon to rank probable dictionary entries for homonyms in the Perseus Greek and Latin lexica. (In effect, this is the print equivalent of the "PageRank" factor which the Google search engine currently exploits8.) This principle seems to hold true as well for the DNB: the entry for Oliver Cromwell the "Protector" is 6,500 words, while that for the biographer is only 250.
Third, we can apply general document analysis to the individual DNB entries and compare the results to the context of passages around ambiguous names. Such document analysis is already a feature of the Perseus Digital Library: we have enjoyed good success in showing those reading Latin or Greek dictionary entries similar words in both languages9. The same strategy can allow us to determine whether the general context of reference to Oliver Cromwell favors the protector or his biographer.
- We also search for possible proper names not recognized from the above knowledge sources. At this stage, we use relatively simple methods. We assume that any word capitalized in mid-sentence can serve as a proper name within the scope of that document. Capitalized words at the start of sentences that fail the spell checker are assumed to be proper names within the scope of the document. We look for connecting words (e.g., "Bank" + "of" + PROPER NAME) and for regular tags (e.g., PROPER NAME + street/church/etc.).
Automatic tagging takes place in two steps, of which only the first has been fully implemented. In the first step, we look for proper names but make no attempt to resolve ambiguities. We tag "Oliver Cromwell" as a personal name but do not try to determine which Oliver Cromwell is meant, nor do we look for instances such as "the Oliver Cromwell" (which might refer to a building or institution named after the historical figure).
Once possible proper names have been tagged, there are various strategies to analyze the context and rank the different possible disambiguations. Our energy at this stage has focused on acquiring and, where necessary, structuring the data that we have had to enter ourselves. Work remains to be done with the resources cited above: we extracted the important information from more than 90% of the entries in the DNB but we need to refine this and increase the yield. We are also still collecting authority lists. The human editor could also enter at this stage, going through the automatically tagged text. Ideally, the editor would find most features properly identified and would have to intervene in only a small percentage of cases.
But even without disambiguation or hand-editing, we have been surprised at how useful the subsequent electronic environment has proven. We consider this to be an important finding in itself because the performance of a system without clever disambiguation schemes or expensive hand editing provides the baseline against which subsequent improvements can be measured. Our experiences suggest that both clever disambiguation and hand editing will add substantial value to documents in a digital library, but, even failing those two functions, the automatically-generated tags can be employed by useful visualization and knowledge discovery tools.
Presenting the Materials
The Perseus XML Document manager processes the tagged texts and images ([5], [6]). A linked GIS manages the geospatial data [7]). Many operations are performed on the data, the most important of which establish automatic connections between different and otherwise isolated parts of the collection.
Automatically added links to "unstructured text." Besides the data already tagged in the file, we add a final class of automatically generated links. The Bolles collection testbed contains many reference works. Some are encyclopedias with flat file structures and simple head words, such as the DNB. Others are more hierarchical and their more complex structure makes them also less predictable. Allen's four volume series on London ([8]) is very clean in structure. Many of its headings simply name major areas and sites within London and its environs (e.g., "St. Botolph without Aldgate") while others are more discursive (e.g., "History and Topography of Portsoken Ward. We therefore do not use these unedited headings to tag documents. Instead the module that prepares documents for view by an end-user compares the text with its database of preferred headings. The phrase "Holy Trinity" in a Bolles text will contain a link to three chapter headings in Allen that contain "Holy Trinity" (e.g., "Priory of the Holy Trinity").
The effectiveness of these links is (as anyone who works with search engines would imagine) unpredictable. In the phrase "St. Katharine's, Coleman," both St. Katherine's and Coleman are linked to external information. St. Katherine's might appear to be more specific, but it points to a discussion of "St. Katherine's docks" and the system does not know that this could be a church. The system at this early stage does not yet know about the various churches named "St. Katherine's." (The GIS data set that we initially received does not contain churches among its prominent buildings.) An editor building up information on London could thus quickly identify this as a gap in the knowledge base. Searching for Coleman, however, delivers quite useful results. The reader can see that Coleman, in the phrase "St. Katherine, Coleman," is probably short for "Coleman-street Ward" and can acquire more information by calling up the chapter on that topic. Since the current context is clearly geographical, the reader can ignore the six entries in the DNB. Having seen that Coleman is probably short for "Coleman-street Ward," the reader has good reason to select "Coleman Street" from the list of three streets. This produces a map locating the street (and the geographic context). These links are inherently less precise than the (potentially) more controlled tags added to the text, but they are also generally applicable.
We can, of course, add more structure to the headers. One easy technique would be to identify those subsets of the headers that we consider significant. Thus we might add a place name tag around "Portsoken Ward" in the header ""History and Topography of Portsoken Ward". The Allen four volume history of London and the six volumes of Old and New London together amount to 3.5 million words but they contain only 2500 headers -- a strategic subset that is much more tractable (and significant) than the raw text. For the moment, these headers belong to a category of "loosely structured" metadata.
We can add metadata links to any text, whether HTML or XML, whether with rich or cursory tagging. Of course, the boundary between knowledge sources applied to generate persistent tags vs. those applied for run-time links is porous: since we do not perform any automatic disambiguation or hand editing on our documents, it makes relatively little difference to the end-user whether we place a tag around "Fleet Street" in the XML document or not, so long as the user ultimately sees a link from Fleet Street to some other knowledge source. The fundamental distinction is, however, profound: we need to determine what information we should store as persistent data (whether embedded as tags in the document itself or as part of a database describing the contents of a document). Clearly, any hand editing should be persistent, and thus any tagging that supports the editor's job should be part of a system that maintains those tags over time. But there may always be some links added dynamically after the editor is done. The dividing line between these may always vary and depend upon the quality of the data, the nature of the subject and the conventions of the scholarly community.
In practice, we try to apply a consistent level of tagging. Where dates are not tagged in the XML document, for example, we scan for dates when we process the XML data. We thus need consistent conventions so that our metadata can tell the post-processor what information is already encoded in the document so that the user can decide what automatic filters to apply.
Aggregation of Tagged Data: Tagged data can be aggregated and the results used for visualization. Temporal and spatial data particularly lend themselves to such techniques, since they are fairly general and readily represented. At present, we are developing automatically generated timelines and maps that cover various spans of information. At present, each English document in the Bolles testbed allows readers to generate sites for the document as a whole or for the current "page" (a unit that varies from document to document but that should encompass a reasonably manageable thematic unit). (See Figures 1 and 2.)
We possess an enormous wealth of information about the historical topography of London and its environs. The challenge is less how to reconstruct 18th or 19th century London than how to represent, in a manageable fashion, the information that we do have. The historical materials that describe London are often extremely hard to use. Old and New London has no maps; Allen's four volume history has superficially useful maps but these prove, in fact, not to locate all of the streets that the text cites, and virtually none of the buildings which Allen describes are labeled. We found it impossible to orient ourselves with the materials at hand. Even locating streets on a modern map was arduous, since we could never be sure whether the streets mentioned in an earlier text still existed under that name. In effect, the reader has to perform an exhaustive search on a substantial portion of the modern London street to establish that a street does not appear in one of the volumes.
The London materials thus allowed (and indeed provoked) us to add a deeper layer of detail. London documents allow readers to "plot streets on this page." Even when we allow for the ambiguity of many London toponyms (terms like "Maiden Lane" and "George Street," etc., apply to numerous streets), the browser can identify the range of choices. The relevant streets usually present an obvious cluster into which the reader can zoom.
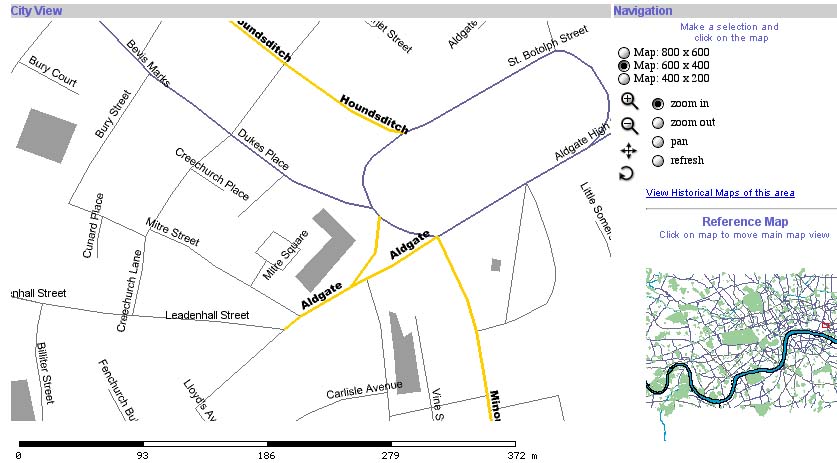
FIGURE 6: Streets cited in Allen's description of "Portsoken Ward"
The modern GIS shows us those streets that still survive under the same name. Since most "pages" in our London collection mention more than one street, we usually can plot enough streets on the modern map to identify the geographic context of the document. We can go a further step to locate vanished streets. First, we have the first of several printed indices to historical maps. We can thus search that index and find the appropriate section of the map (e.g., identify that "Agnes Place" shows up in the 1828 Cruchley map and then call up the tile labelled "F f"). Second, we can browse using the geospatial data that we have collected. At present, when users zoom in to a sufficiently small subset of the city, a link entitled "View Historical Maps of this Area" appears. Clicking on this link sends the coordinates of the current modern map to the GIS. The GIS then extracts the equivalent sections of the geo-referenced historical maps.
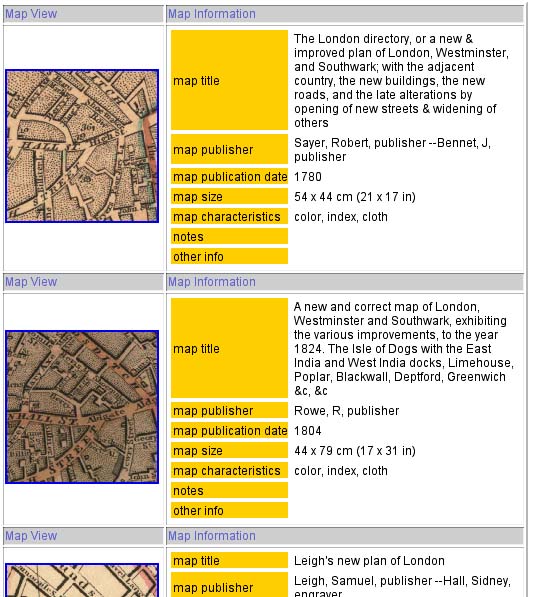
FIGURE 7: Historical Views of the section of London presented above
The reader can then browse the historical maps. Clicking on one launches a new browser that lets the reader scan that map in detail. Since the maps are sorted chronologically, the reader can often see the evolution of the city reflected in the changing maps. Duke Street, for example, which shows up in a map dated 1808 is still green fields in the 1790 map.
We are also developing automatically generated timelines. Historical texts often have striking visual signatures when dates are plotted against pages within the source text. TIMELINE 1 shows the date chart for a the first volume of Allen's history: a reader can see at a glance that this volume moves chronologically through the history of London, while the increasing slope of the curve demonstrates the fact that the author increases his coverage as he moves forward in time. The third volume describes the topography of the City of London. Since it focuses on one building after another, its chronological focus moves back and forth, as it describes the history of each building and section of the city. The dates in TIMELINE 2 are scattered but the aggregate totals (figured in green above) show an unmistakable spike in the 1660s that then tapers down in subsequent decades. This reflects, of course, the terrible fire of London, which destroyed much of the city in 1666. These timelines thus provide clues to the content and focus of documents. They also provide browsing aids, since the user can drill down into greater levels of detail or go from the timelines to the relevant sections of the document.
Current and Future Work
Our first goal is to consolidate and make available the materials and functions described above. While work remains to be done and we need to finalize design decisions for the first release, the general structure is in place. We need to streamline what we have, implement basic disambiguation procedures, and refine the data that we have. We also need to make better use of the image data that we can harvest from figure headers and from the texts spans which Bolles selected. To this end we will need to digest work being done in semi-automated cataloguing.
Second, we need both to enhance the digital library environment and to expand the content of the collection, since each of these drives the other. The richness and complexity of the content drives the development of the system, while the increasing sophistication of the system allows us to reevaluate the uses to which we can put the data. We obviously need to evaluate disambiguation and visualization strategies. The next major step will be to develop the single temporal-chronological interface mentioned earlier. Users viewing the Perseus Digital Library as a whole, the Bolles London materials or an individual document should be able to generate a linked map and timeline, illustrating the most densely covered points in time and space. For Bolles, there would be clusters in the London and England as a whole on the map while the timeline would show dense coverage from the sixteenth through nineteenth century. Users should be able to drill down both chronologically and temporally: a user should be able to select arbitrary regions on the map and timeline, generating queries such as "locate documents that mention this section of London in the 1620s" or "places within a subsection of Surrey in the 1880s."
Conclusions
Our work with the Bolles London materials has proven extremely valuable to us. It constituted our first project on a relatively modern topic, with vast amounts of data and source texts primarily in English. The techniques that we had developed in our work on Greco-Roman Perseus did, as we had hoped, constitute a solid foundation for this project, while the richness of the data allowed us to experiment with new ways of representing and visualizing people, things, space and time. We are planning to work now with collections relevant to American history. The Bolles London work has made it possible to contemplate new collaborations with historical collections in the United States and even a testbed focusing on slavery and the American Civil War.
Four general conclusions emerge from our work so far. First, the automatic links generated from a moderately-developed knowledge base such as the current Bolles archive can, even without sophisticated filtering, make a great difference for those working with an unfamiliar environment. This approach, developed for the Greco-Roman Perseus project, has proven even more effective with the London materials. While there is noise in the current unfiltered system, our first impression is that the utility greatly outweighs the drawbacks of occasionally unpredictable links. The automatically generated city maps and historical views are particularly powerful. Even with ten geo-referenced maps, users can browse much more effectively than they could trying to work with the ten large paper maps (even if these were available in new resilient paper).
Our second conclusion affects the organization of labor within the humanities as a whole. At present, we tend to have two broad categories of digital publication projects. At one extreme stand massive projects such as the Making of America Collection10 or the monumental American Memory Project <http://www.loc.gov>. In these, librarians manage immense bodies of material, laying the foundation for more individual editorial projects. At the other extreme stand intensive editorial efforts. These may, like the New Variorum Shakespeare Series, be studying how to respond to the challenges and possibilities of new digital media. They may, like the William Blake Archive11, shrewdly exploit the possibilities of the new medium to publish editions that are fundamentally more useful than any print counterpart could be. Nevertheless, these editorial projects, large as they are, follow the traditional model, in that human beings carefully go over every word and every image by hand. These projects provide models for how the best practices from traditional libraries and editorial efforts can evolve and adapt to meet radically changing circumstances.
The Bolles London Electronic Archive constitutes a new, middle ground. On the one hand, it is much smaller and to some extent more focused than the Making of America Collection or the American Memory Project. The Bolles Electronic Archive is a small, carefully chosen and carefully integrated collection. We edit the texts, images, and maps to create something like a complex edition. We have enough scholarly expertise in the project to do a reasonable job but we are acutely aware that none of us has the specialized knowledge needed to push the Bolles archive to the next level. To do so, we either need to acquire that expertise ourselves or find an appropriate collaborator. On the other hand, with nearly five million words and ten thousand images in place, and with both totals likely to grow considerably, we simply cannot read every word and study every image with the care that marks developed editions. We could have stopped adding materials and focused on what we had, but we decided that it was more important at this stage to have a large, less polished collection than one that was smaller and more refined. We need individual editions and we need huge collections, but we also need medium sized projects. As we begin the staggering task of representing our cultural heritage in digital form, projects like the Bolles collection will play a crucial role by creating a new intermediate project, a "corpus edition,"[12]. midway between a traditional edition and a library collection.
Developing a true corpus edition requires the same traditional scholarly background as traditional editing, but it also requires technical expertise and a deep appreciation for cataloguing and other fundamental library tasks. Corpus editors will need to rely upon their knowledge of the field to help them decide not only what to collect but what sorts of structures to add. Corpus editors must also depend upon their technical skills to process far more material than they can manage with traditional methods. (They also need a corresponding tolerance for self-conscious imperfection.) And corpus editors must work closely with their colleagues in the libraries if they are to create collections of persistent value.
Unfortunately, virtually no graduate programs train students to be corpus editors. We have been successful in Greco-Roman Perseus because we have allowed classicists substantial amounts of time to acquire fundamental skills. Jeffery Rydberg-Cox, now an assistant professor at the University of Missouri at Kansas City, acquired an impressive knowledge of computational linguistics and the software design skills to apply this knowledge to Greek and Latin. Mark Shiefsky, now an assistant professor at Harvard, similarly spent a year as a scholar technologist at the Max Planck Institute for the History of Science in Berlin. His ability to bridge, in practical as well as theoretical terms, the gap between scholarly goals and material practice has considerably extended the range of questions that the team in Berlin could address. The knowledge that both acquired have made them a resource from which the field of classics can benefit for decades. Our third conclusion is that classics -- and all the humanities -- need more people with skills such as theirs, but that we do not yet have the institutional structures in place to produce them.
Our final conclusion is that we need a richer model for data exchange if federated digital libraries are to realize their potential. In the traditional model, we use metadata to locate objects -- whether books or digital documents -- but the library system leaves it to some other system to display the data. In the print library, the user uses the catalogue to find the book; in most models of federated DLs, the catalogue directs the user to a site that displays its data in its own proprietary way. We believe that a mature DL should also provide users with novel ways to visualize data. To do so effectively, however, the DL system needs access to the full content of distributed collections. Content producers need to recognize that multiple frontends to their proprietary data are not only natural but beneficial12. It may be that some monolithic DL system may become the "Windows" of the digital library world, but we are skeptical that such standardization would be constructive at any point in the foreseeable future. We need many different systems that can produce new and distinct forms of value from the same data. The aggregation tools and added links in the Bolles London collection are early examples of what can be done.
References
[1] G. Crane, "The Perseus Project and Beyond: How Building a Digital Library Challenges the Humanities and Technology," D-Lib Magazine, 1998.
[2] B. Boguraev and J. Pustejovsky, Corpus processing for lexical acquisition. Cambridge, Mass.: MIT Press, 1996.
[3] M. T. Pazienza, Information extraction : a multidisciplinary approach to an emerging information technolology : international summer school, SCIE-97, Frascati, Italy, July 14-18, 1997. Berlin ; New York: Springer, 1997.
[4] S. Lee, Dictionary of national biography. New York London: Macmillan Smith Elder, 1903.
[5] D. A. Smith, A. Mahoney, and J. A. Rydberg-Cox, "The Management of XML Documents in an Integrated Digital Library," presented at The 2000 Extreme Markup Conference, 2000.
[6] J. Rydberg-Cox, D. A. Smith, A. Mahoney, and R. F. Chavez, "Ancient Documents and Modern Technology: XML and Digital Libraries," Ariadne, 2000.
[7] Chavez, R. Generating and Reintegrating Geospatial Data. in The Fifth ACM Conference on Digital Libraries. 2000. San Antonio: ACM.
[8] T. Allen, The history and antiquities of London, Westminster, Southwark, and parts adjacent. London,: Cowie and Strange, 1827.
[9] "Making of America," 1996. <http://moa.umdl.umich.edu/>
[10] "The Making of America Collection," 1999. <http://moa.cit.cornell.edu/MOA/moa-mission.html>
[11] M. Eaves, R. Essick, and J. Viscomi, "The William Blake Archive," Institute for Advanced Technology in the Humanities, 1997.
[12] Crane, G. and J.A. Rydberg-Cox. New Technology and New Roles: The Need for Corpus Editors. in The Fifth ACM Conference on Digital Libraries. 2000. San Antonio: ACM.
Copyright © 2000 Gregory Crane
Search | Author Index | Title Index | Monthly Issues
Previous story | Next Story
Home | E-mail the Editor
D-Lib Magazine Access Terms and Conditions
DOI: 10.1045/july2000-crane